Modal split
The modal split is a formal metric that indicates the percentage share of each type of transport used by travellers. As such, the modal split tells how people move around the city and allows local administrators to make better informed decisions with a view to increase the share of sustainable mobility.
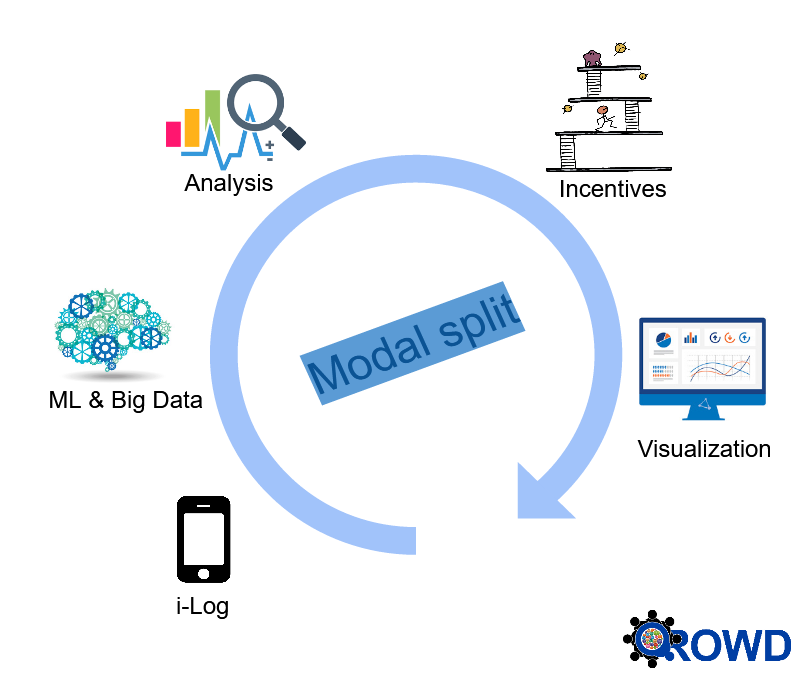
Data to calculate the modal split are usually collected through surveys. Qrowd offers the unique opportunity to bypass traditional methods (such as telephone interviews and paper questionnaires which have proved costly and inaccurate) and employ techniques which are able to guarantee a faster and more accurate data collection process:
- Data are collected from the citizens through a dedicated app called i-Log. The app collects data from the smartphone’s sensors (citizen sensing) and asks questions to validate or complement them
- The data collected through i-Log are analyzed using machine learning techniques to learn information about the trips made and consequently reduce the number of questions sent to the users
- Citizens are incentivized to actively partake in the collection of the data and are awarded prizes upon meeting predefined thresholds
- The modal split is calculated by aggregating the data and information collected from the citizens and is visualized graphically on the dashboard
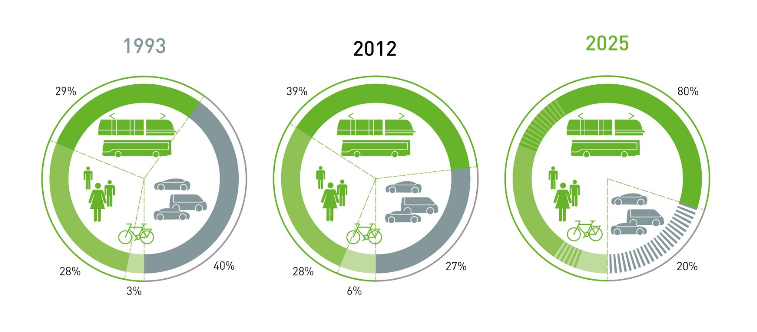
The figure above shows an example of how the modal split can be visualized. These data do not refer to the city of Trento.
Results
7 studies have been organized throughout the project to improve the data analysis process and the usability of the i-Log app. About 220 participants tracked their daily trips, modifying the detected trips or adding new ones directly from the app. Thanks to the feedback collected from the participants at the end of each session, a step-by-step guide was set up to help them configure the smartphones correctly. Furthermore, tailored assistance was provided to those who encountered difficulties.
The final study involved around 150 participants that tracked a total of 888 trips. The aggregated data has been integrated in a section of the dashboard reserved for the Municipality while a personal modal split report showing the individual trips taken on the days of the study was sent to each participant.

Area tematica dedicata a Trento Smart city

Per ulteriori informazioni si rimanda al sito ufficiale del progetto


